
Data
The “Data” category encompasses a rich repository of subcategories including stocks, options, indices, and more, providing a comprehensive overview of the vast array of financial market data available through our services. It’s crafted to cater to traders, investors, and developers seeking in-depth insights and analyses on various asset classes. Through detailed descriptions, usage examples, and insights into data trends, this category aims to support informed decision-making and strategy development for market participants of all levels.
No articles on this page match that filter.

Smart Mid: A Better Real-Time Market Price
Our proprietary model to estimate a fair real-time value for any stock, built on top of IEX market data.

Missing Options Contracts — Why You Can’t Find Them
Understanding the common reasons traders can't find certain missing options contracts. The importance of knowing how options contracts are created and traded.

How To Use The Mutual Fund API
Learn by example and get started with the mutual fund api. Get candlestick and pricing data going back decades.

Getting Started With The Golang Stock API
Get financial data in Go using the Golang Stock API. The SDK includes a variety of methods for accessing financial data such as real-time stock quotes.

How To Bulk Download Stock Data in Google Sheets
Download stock data in bulk with the STOCKDATA formula for Google Sheets: many symbols in one request, so large spreadsheets refresh fast and cost less.

How To Get An Earnings Calendar For Any Stock In Google Sheets
Add an earnings calendar to Google Sheets using Market Data's EARNINGS formula. Find what Wall Street Analysts are projecting for next quarter.

How To Use The Free Stock Market API: A Guided Tour of our Swagger UI
Finally, a free stock market API without scraping or proxies. Learn how to get stock pricing data, both current and historical, using swagger.

How To Use The Stock Market Holidays API
Use the stock market holidays API to get the open or closed status for any date in the past, present or future.
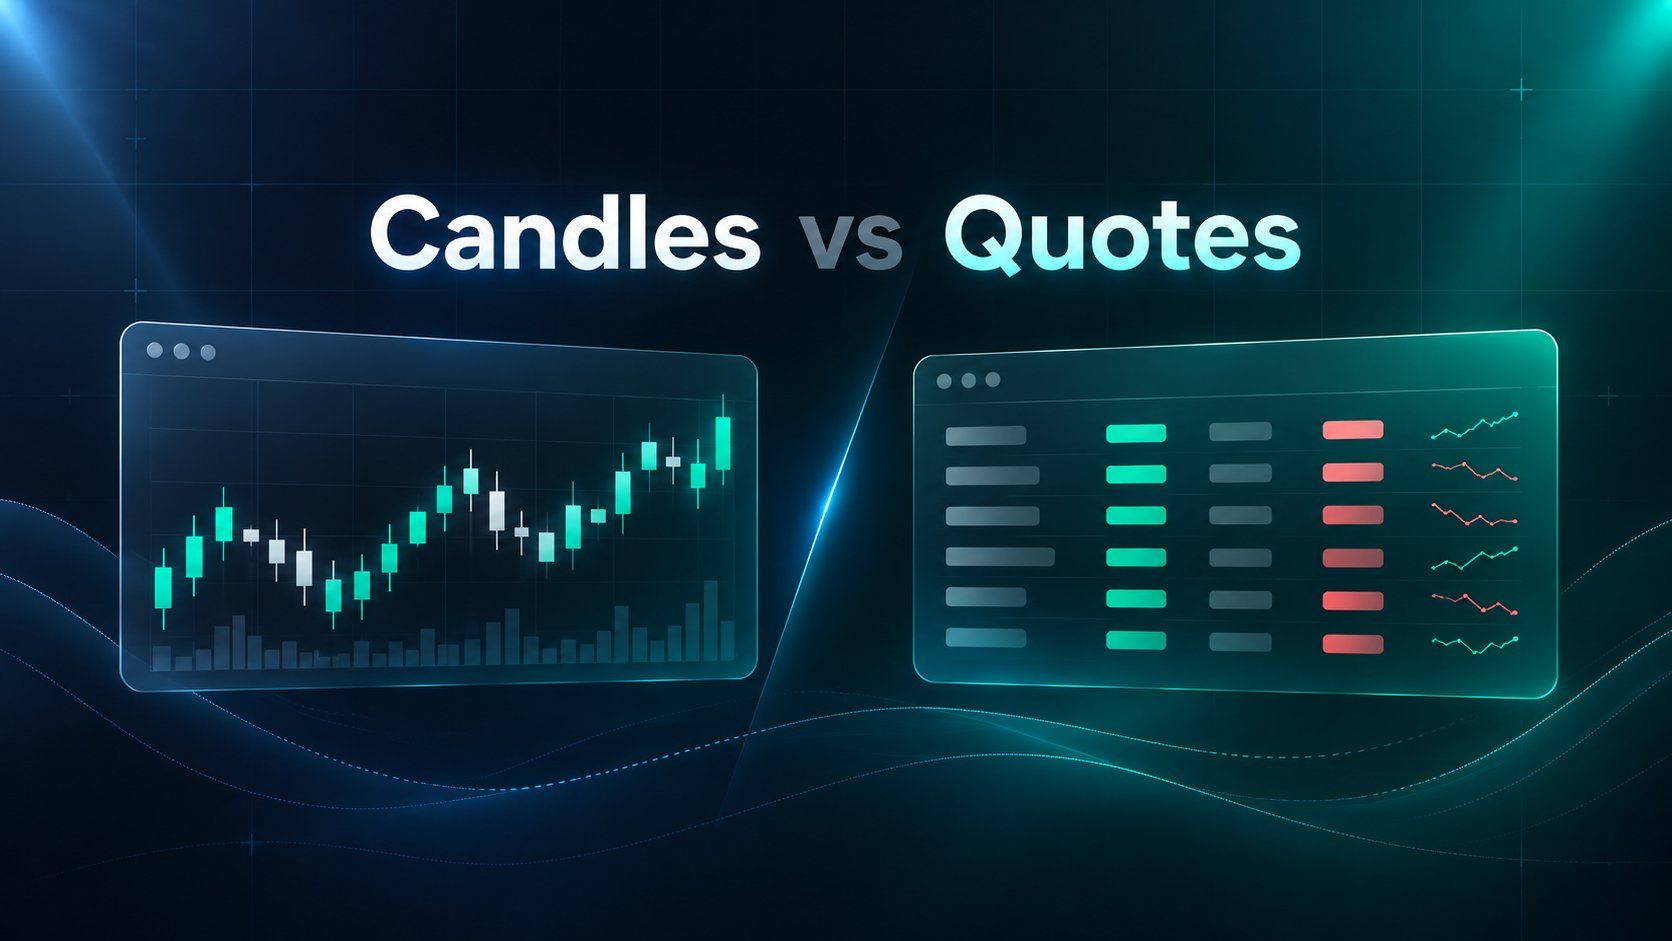
Candles vs Quotes, What’s The Difference?
Candles or quotes? STOCKDATA returns both, and picking the wrong one skews your spreadsheet. Here is what each one holds and when to use it.

How To Get An Option Chain In Google Sheets
Use the OPTIONCHAIN formula to get a complete real-time option chain in Google Sheets. Filter by date, days to expiration, strike, deltas, and more.

How to Calculate Theta For An Option
Learn how to calculate theta for an option and add time decay to your Google Sheets spreadsheet with the OPTIONDATA formula and Black-Scholes.

How To Get Historical Options Prices For Your Spreadsheet
Using the Market Data Add-on, it is possible to get historical options prices going back decades directly into your spreadsheet with a simple formula.

How To Use The Historical Stock Data API
Learn by example and get started with the historical stock data api. Both daily and intraday data is available going back decades.

How To Use the Stock Market API — With Examples!
Get real-time and historical market data from the stock market api. Learn quickly with easy to use examples that work right from your browser.

How To Use The Option Data API — With Examples!
The Option Data API allows you to easily get a real-time or historical option quote for stock, ETF, or index options.
How To Calculate The Intrinsic / Extrinsic Value of an Option In Your Spreadsheet
Using the OPTIONDATA formula, you can automatically calculate the implied volatility of any option that is currently trading.
How To Calculate Implied Volatility In Your Spreadsheet
Calculate the implied volatility of any option in Google Sheets with the OPTIONDATA formula, then chart the volatility curve across a whole option chain.

How To Calculate Option Greeks In Your Spreadsheet
The OPTIONDATA formula pulls delta, gamma, theta and vega straight into your spreadsheet, so position risk updates itself with the market.
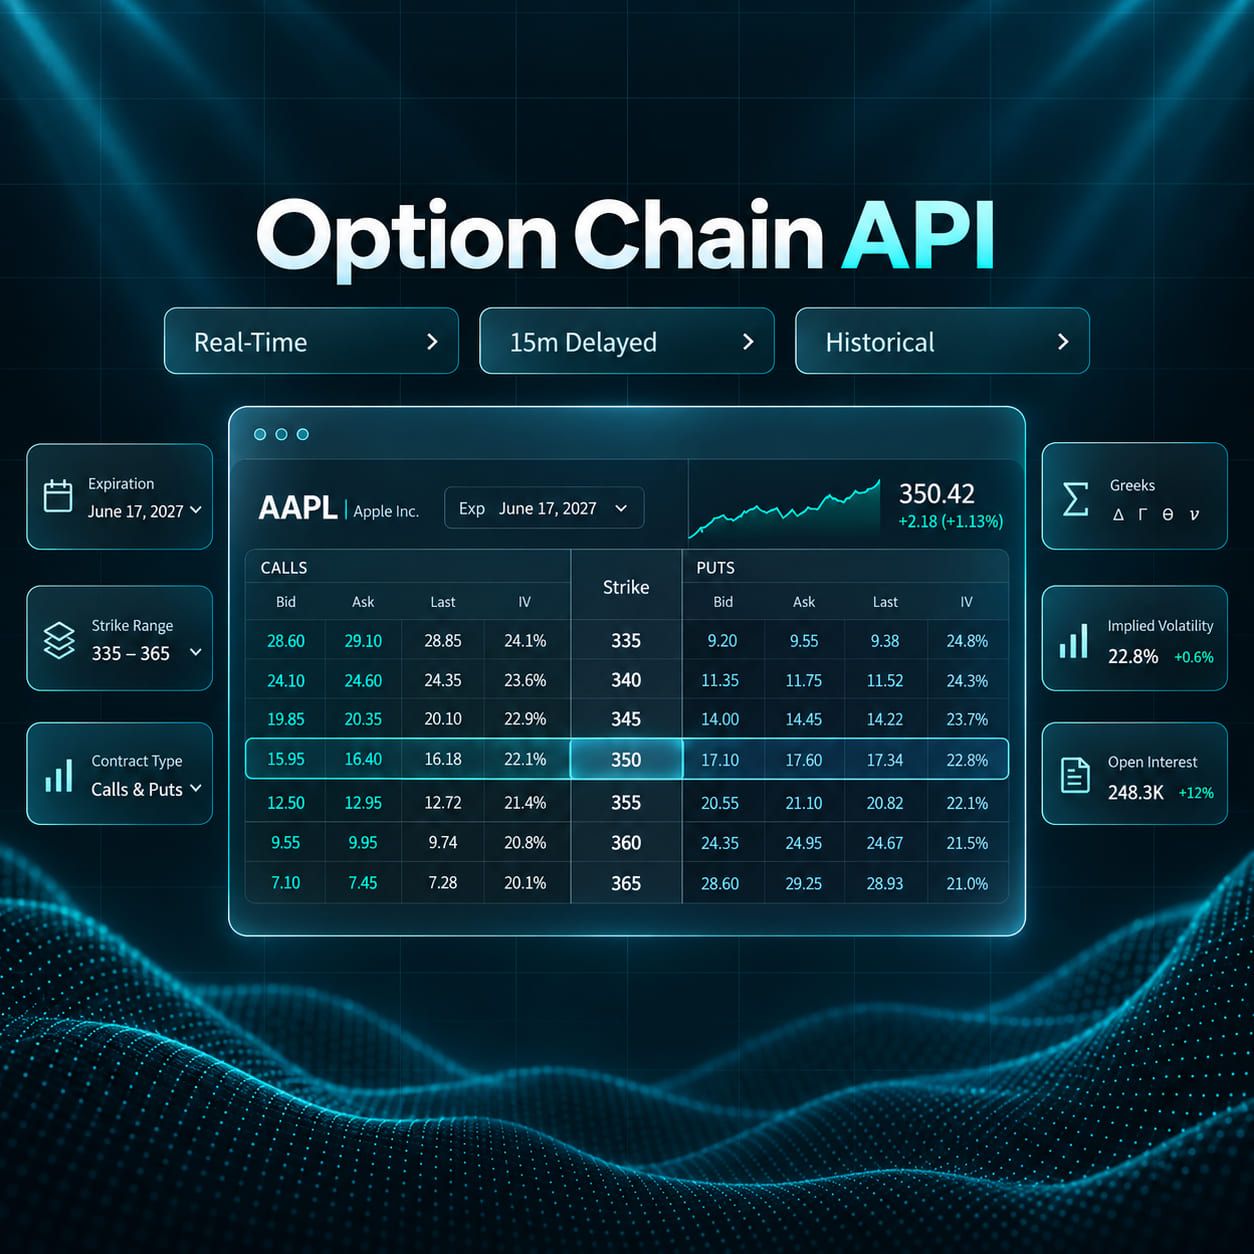
How To Use The Option Chain API — With Examples!
The Option Chain API allows for ample sorting & filtering during each request, making it easy to get exactly the data you need.
How To Get Real-Time Stock Prices in Google Sheets
The GOOGLEFINANCE formula gives 15-min delayed stock prices. Get real-time stock prices into Google Sheets using the STOCKDATA formula.
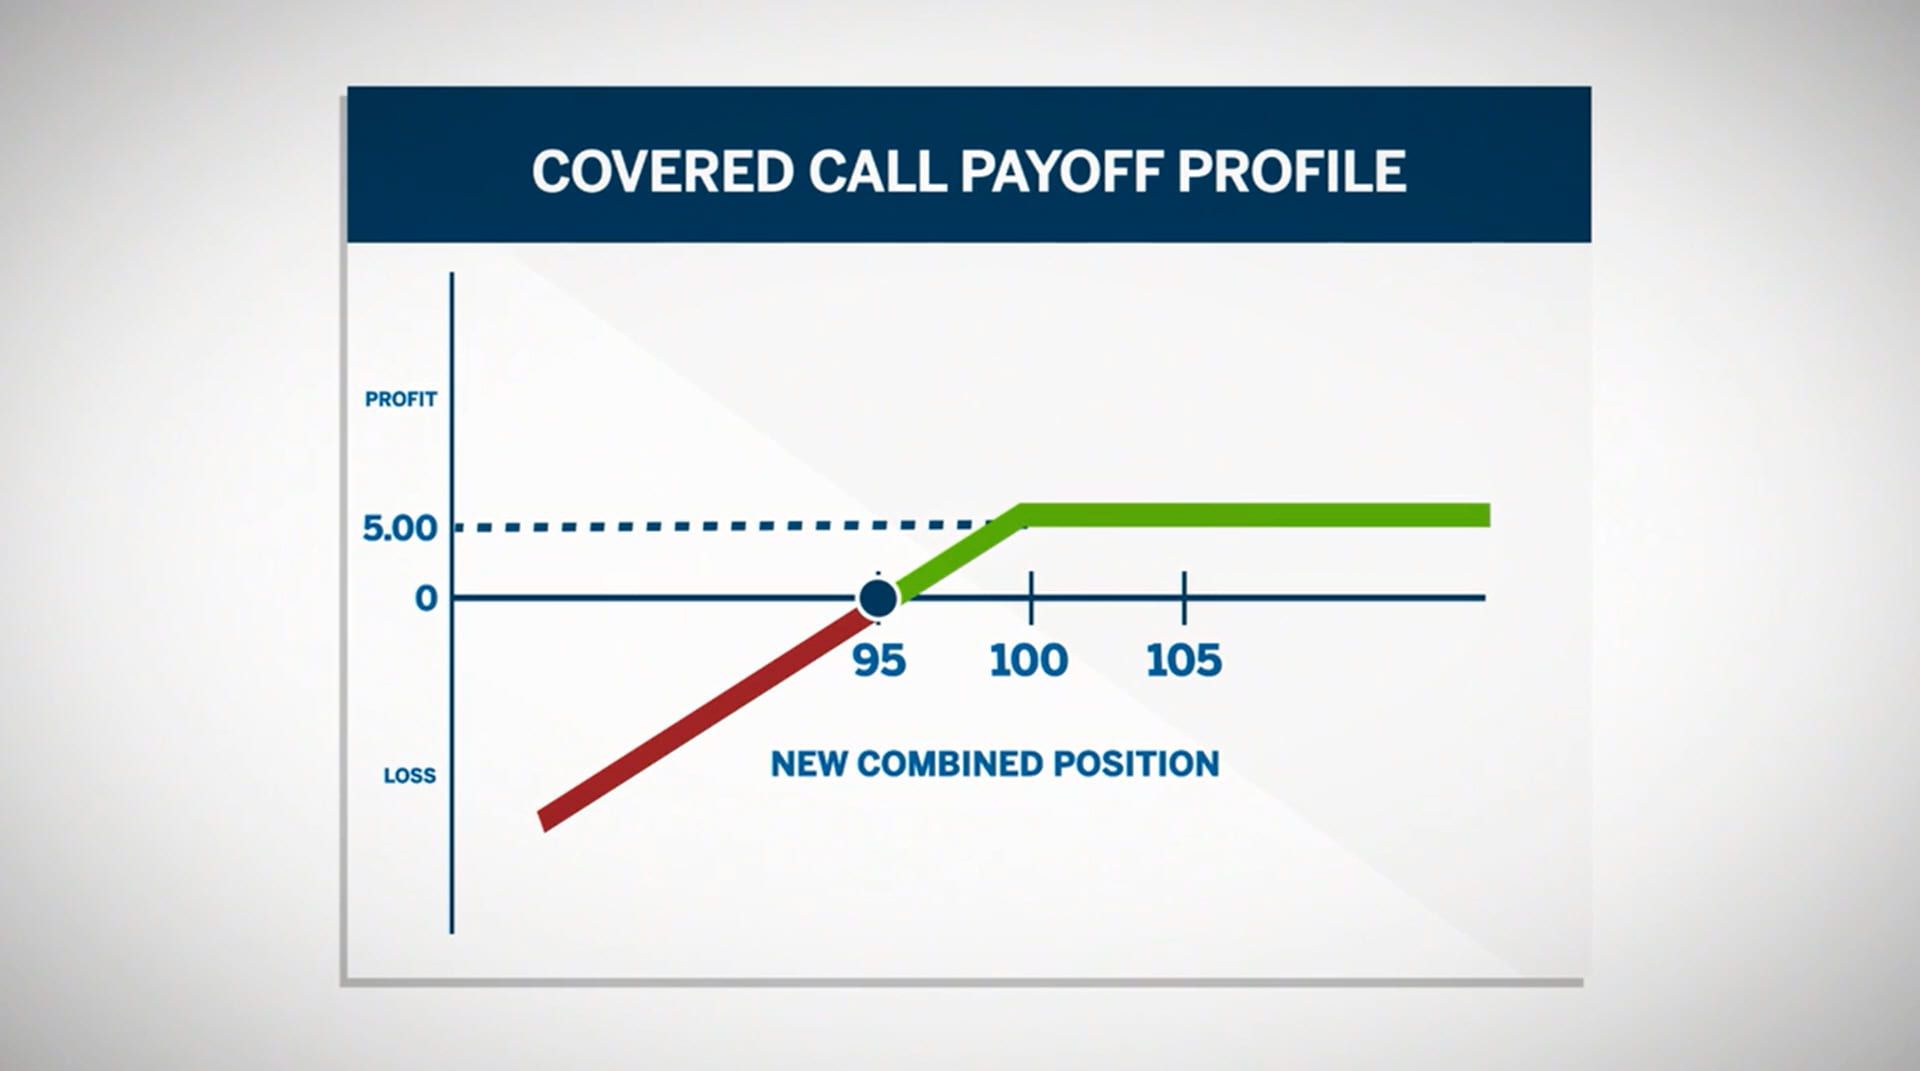
How To Build A Covered Call Spreadsheet
Build a covered call tracker in Google Sheets, formula by formula — and download our free example sheet to start tracking your positions today.

How To Get Intraday Stock Prices in Google Sheets
Learn how to get intraday stock prices in Google Sheets (with prices down to the minute) using a simple formula that works the same way as GoogleFinance.

How To Download Historical Options Prices in CSV Format
Market Data makes it easy to download historical options prices for the entire market or for a single symbol.
How To Get Options Prices in Google Sheets
Learn how to add real-time and historical options prices into your Google Sheets spreadsheets using a single formula.